


React team launched a new version of the React Dev Tools (v4) a few weeks ago and it’s fantabulous. It gives you debugging superpowers to navigate through your tree, trace data flow, spot weak links and optimise for perf.
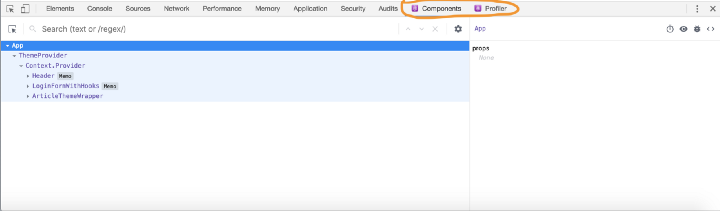
There are two separate tabs (Components, Profiler) now as opposed to the old version which had only one React tab.

New Dev Tools has great many improvements over the old version. To highlight a few —
- 🏎 Faster
- 🎣 Hooks support
- 🧐 Advanced tree filter
- 🤠 Better search UX
- 👮♀️ Badges for HOCs
- 🎯 Remembers selection after page reload
Top 10 Features
Dev Tools can do a lot of things. We’re are not going to dive into the nitty gritty details of each and every feature. Instead we’ll take a look at the top 10 helpful features that help us save time and write better React code.
Components Tab
- Live edit state/props
- Search through tree
- Advanced tree filter
- Rendered by
- Owners tree
- Quick Navigation
- Utils
Profiler Tab
- Profile initial mount
- Why did this render?
- Rendered at
1. Live Edit State/Props
You can live edit the state and props of a component and instantly see the results in the page.
2. Search Through Tree
The search bar comes handy when you want to quickly find and jump to a component in the tree. Now that the Dev Tools can remember stuff the selected node is saved between reloads and you don’t have to repeat the action every time you reload the page.
3. Component Filter
Filter is a powerful feature to reduce visual noise and focus on what matters at the moment in a huge tree. You can filter with a variety of options like context, HOCs, host(DOM) nodes, component name, etc.
4. Rendered By
Rendered By is a list of owner/parent components that rendered the selected component. You can quickly jump to a parent component by selecting an entry from the list.
5. Owners Tree
Owners Tree gives you an eagle eye view of a particular component and its sub-tree and hides the rest of the component tree.
To enter into owners tree view, you have to double click a component in the tree.
6. Quick Navigation
Switching between Elements tab (browser dev tools) and Components tab (react dev tools) is pretty easy and the corresponding node is auto selected in these tabs.
To find the corresponding DOM node in the Elements tab, select the component and click the small eye icon on the right pane. It will take you to the Elements tab with the corresponding DOM node selected.
To find the corresponding React node from Elements tab, just select a node in Elements tab and click the Components tab. React Dev Tools will automatically select the corresponding component.
7. Utils
Components tab offers three small handy utils.
- Suspend component
- Inspect matching DOM element
- Log component data to console
Suspend Component
You can easily switch between the waiting(loading) and resolved states of Suspense components.
Inspect matching DOM element
We already saw this in Quick Navigation. You can select a component and click the eye icon on the right pane to jump to its corresponding node in Elements tab to inspect it.
Log component data to console
This is a handy utility that logs the entire component meta data to the console. The log gives details like props, hooks, corresponding DOM nodes and the component file location in the file system.
To log component data to console, select the component and click the small bug icon in the right pane.
Intro to Profiler
The next three features are going to be about the Profiler. Before diving into them, we’ll take a look at how profiler works and the key metrics that are used during profiling.
Every profiling session has two important colour graphs —
- Commit graph
- Component graph

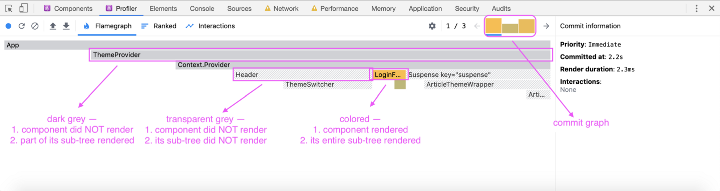
Commit Graph
Commit graph gives you a list of commits (whole tree) during the session. Each commit denotes a user activity or side-effect that triggered a render in the tree .You will see it coloured from orange to green with orange denoting the costliest (took most time) commit and green denoting the cheapest (took least time) commit.
Component Graph
Component graph gives you info on which component rendered during a single commit. You can select each commit from the commit graph to see its component graph. It is also colour coded with cost information —
- Dark Grey — Component did not render but a part of its sub-tree rendered
- Transparent Grey — Neither the component nor its subtree rendered
- Coloured — Both the component and its entire subtree rendered
8. Profile Initial Mount
Initial mount and first render is usually a perf heavy op in most React applications. In older versions of Dev Tools, it was impossible to profile and audit the initial mount phase. But the latest version provides an option to profile and audit the initial mount.
9. Why Did This Render?
This is the most powerful feature of the Dev Tools yet and it tells you why a component rendered during a profiling session. A component might have rendered for one or many of these reasons —
- Props changed
- State changed
- Hooks changed
- Parent component rendered
You can profile an activity and see why a component rendered during the profiling session to spot weak links and prevent unnecessary renders in the tree.
Note: You have check this setting — “Record why each component rendered while profiling” to see this info in the right pane of the Profiler Tab.
10. Rendered At
Rendered At info on the right pane gives you two time metrics —
- When exactly the component rendered during the profiling session
- How long it took for the component to render during the profiling session
Eg. 2.2s for 2.3ms
Here, 2.2s means the component rendered at 2.2s(2200ms) from the start of the profiling session which is 0s. And 2.3ms is the amount of time it took for the component to render.
That’s all folks.
If you’re interested in exploring all the features, the React team has built a site just for that — Interactive Dev Tools.
Play around with Dev Tools and drop a comment below or start a conversation with the author in Twitter on what you think.