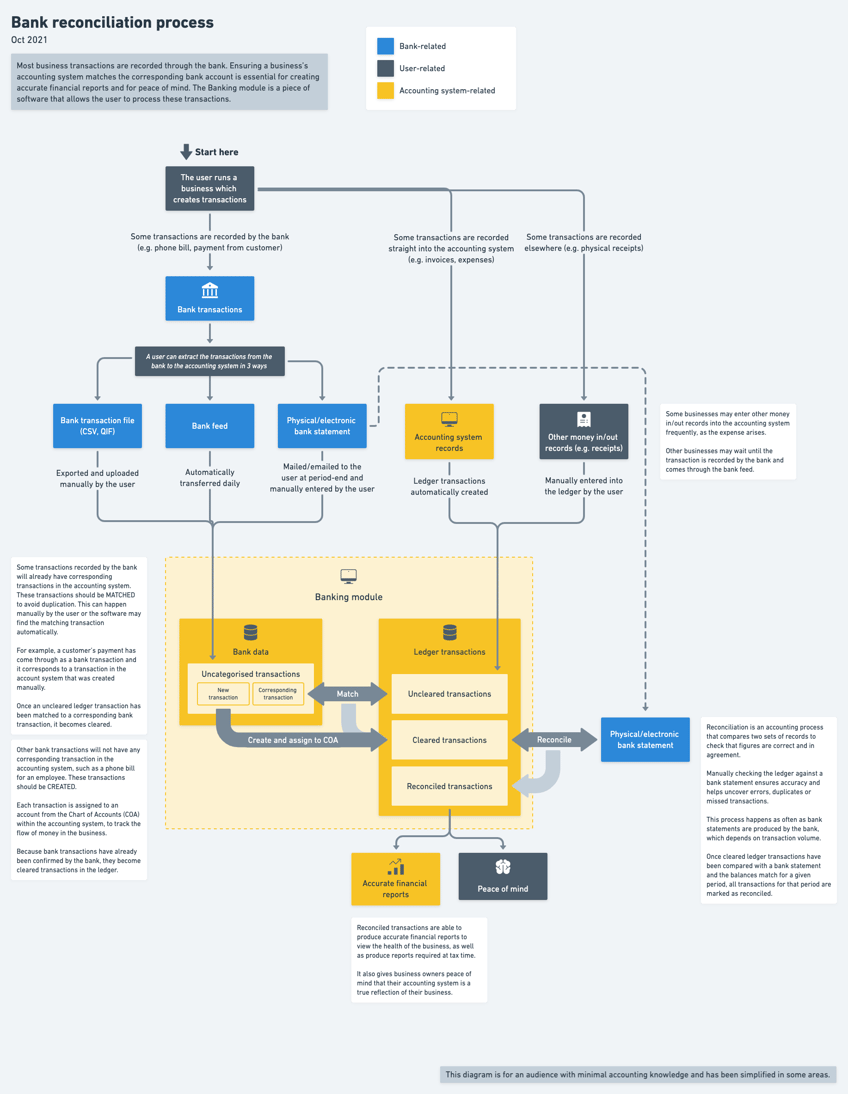
Introduction
Process mapping is the an activity oriented around the generation of a flowchart which captures the movement of information and user interaction within a system. It helps to establish a shared understanding with team members and is especially useful when the system contains complex user interactions and/or movement of data. If a project has a steep learning curve, process maps are a quick way of getting new team members up to speed.
People & participants
Process mapping exercises are typically co-led by a Technical Architect and UX Designer in consultation with stakeholders, subject matter experts, and real users. As the map captures both the movement of data, and the activities of end users, we’ve found that having representation from both design and engineering disciplines is vital.
Instructions
Prep
Decide how you would like to generate the process map. This is best done through a flowchart tool like Whimsical, or in-person during a white boarding session
Depending on the system’s level of complexity, and how well the designer and engineer understand the project and its related core concepts, process mapping can be done as a real-time collaborative session with subject matter experts.
Method
- Book in a session with a Subject Matter Expert or the Product Owner. This session is all about asking questions about how the system works, using questions like:
- Why is the user using the system?
- What are the sources of data?
- Where is the data stored?
- How and why does the data move throughout the system?
- How does the user interact with the data?
- What are the outputs of the system?
- As you’re talking with participants capture your findings in the form of a flowchart, adding detail, and supporting information as you go.
- After the session, tidy up the flowchart, adding orientating elements like icons, colour coding, and a legend.
- Add descriptive text boxes if needed.
- Give your diagram a header and add the date and a description.
- Review your flowchart, remembering who the audience is and reading it as if for the first time (it should be as standalone as possible). Share with a team mate who can provide feedback.


A useful reference for user journey mapping
The process mapping activity overlaps nicely with user journey mapping in that a lot of the core user interactions need to be teased out into a journey of discrete tasks. Getting clear on the high-level process, and the way data needs to move within the system makes for a useful foundation to capture all the activities a user can achieve within the system as a subsequent step.


